
Waystone Explores Negatively Correlated Strategies for Risk Management
On 23 March 2020, the MSCI was down nearly 32% on the year, only to finish up just under 16%. It’s easy to forget that this was the shortest bear market on record and the recovery, spurred on by record government stimulus, should not be considered the likely outcome of the next sell-off, stressing the importance of a well-diversified portfolio.
A key area of diversification is an allocation to an uncorrelated alternative strategy. Whilst some uncorrelated strategies proved their role in the March sell-off, others disappointed investors, failing to hold up as volatility spiked. Given this, we have seen increasing interest in strategies that would explicitly target negative correlation, to play a more direct risk mitigation role in portfolios allowing investors to maintain risk-on exposures but with a higher probability of success during the next crisis.
Incorporating Negatively Correlated Strategies into Portfolios
At Waystone, we have observed how investors have struggled to incorporate negatively correlated strategies into their portfolios. This has led us to search for a solution to the problems addressed below, to find a negatively correlated strategy albeit with a through-cycle positive expected return: Contra.
Tail Risk Strategies
Many of these had impressive returns in March 2020 but the primary concern is that they need to be timed well, which comes with many challenges. The issues that tail risk strategies present are negative expected return and consistent delivery in negative markets, as highlighted in the below tables and in the statistics for the CBOE Eurekahedge Tail Risk Hedge Fund index (since inception, January 2008).
CBOE Eurekahedge Tail Risk Hedge Fund Index |
|
|---|---|
| Annualised Return since January 2008 | 3.28% |
| Average Rolling 12-Month Return | -2.38% |
| Median Rolling 12-Month Return | -7.41% |
| % of months up when MSCI World down | 44.07% |
| Correlation | -0.50 |
CBOE Eurekahedge Tail Risk Hedge Fund Index
| Negative Months of Equity Markets | Occurrences | Tail Risk Average Performance | Tail Risk Positive Performance% |
|---|---|---|---|
| Up to -1% | 11 | -1.14% | 18.18% |
| Up to -2% | 23 | -0.89% | 30.43% |
| Up to -3% | 33 | -0.59% | 30.30% |
| Up to -4% | 39 | -0.54% | 33.33% |
| Up to -5% | 41 | -0.62% | 31.71% |
| More than -5% | 18 | +6.54% | 72.22% |
| More than -10% | 4 | +12.20% | 75.00% |
| All Negative Months | 59 | +1.57% | 44.07% |
Please note: statistics are based on the CBOE Eurekahedge Tail Risk Hedge Fund Index since launch, January 2008 to December-end 2020.
Overcoming these two negatives is crucial to create a product that investors can actually hold long term in their portfolios, knowing it will produce a positive return when they need it. The current solutions, as measured by the index, of offering only a 44.07% success rate in down months, 72% success in down months of greater than -5% along with a median 12-month rolling return of -7.41%, does not seem to provide investors with long-term investible options.
Volatility Strategies
Volatility strategies are another strategy that we see investors considering here too. For many years, volatility traders overcame the issues faced by tail risk managers but since mid-2012, their performance, as measured by the CBOE Eurekahedge Long Volatility Hedge Fund Index, has become less absolute return and less reliable in down months, albeit with an increased negative correlation. As a result, this index resembles the tail risk index more closely.
CBOE Eurekahedge Long Volatility Hedge Fund Index
| January 2005 – May 2012 | Since June 2012 | |
|---|---|---|
| Annualised Return | 11.96% | -1.24% |
| Average Rolling 12-Month Return | 13.04% | 0.07% |
| Median Rolling 12-Month Return | 10.68% 10.68% |
-2.91% |
| % of Months up when MSCI World down | 64.29% | 58.06% |
| Correlation | -0.21 | -0.66 |
Please note: statistics are based on the CBOE Eurekahedge Long Volatility Hedge Fund Index since launch, January 2005 to December-end 2020
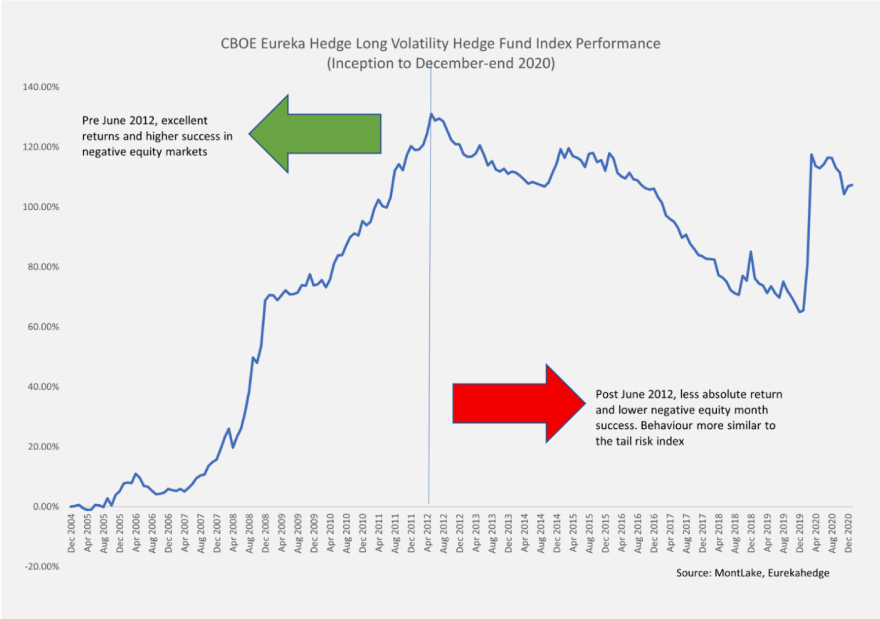
Volatility traders with a long bias seem to now suffer from the same issues as tail risk, as the dynamics in the markets have made the absolute returns pre-2012 harder to achieve. In conclusion, while tail risk and volatility strategies can be extremely beneficial during large market sell-offs, their overall negative long-term expected return can be difficult for investors to hold long term.
Negatively Correlated Strategies for Positive Expected Returns
At Waystone we have been searching for a strategy that can provide negative equity beta while delivering a through-cycle, positive expected return with a higher success rate in down equity months and a consistent negative correlation. During our research, our partner Crabel Capital Management identified the same demand and were building a product to fit this profile.